How to Read a Restaurant P&L Statement (Even If You've Never Seen One Before)
OAOn A Wait Hospitality · September 17, 2026 · 4 min read
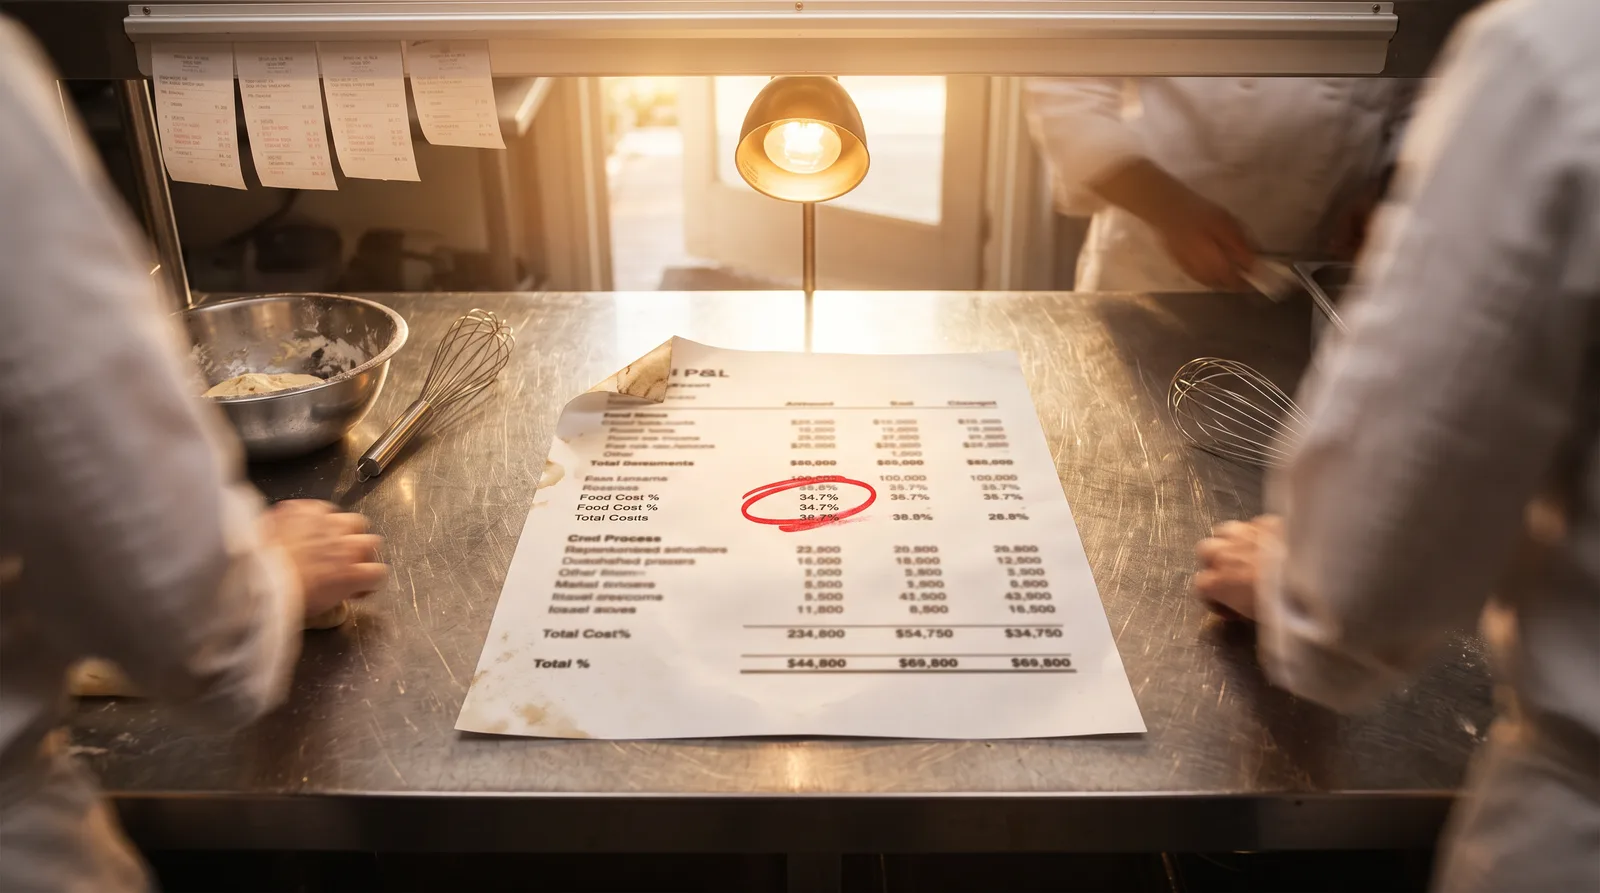
The first time most people see a restaurant P&L, they feel a little like they've been handed a document in another language. Numbers everywhere, categories that sound similar, and no obvious place to start. Here's the truth: once you know what each section is measuring, the whole thing snaps into focus fast. Let's walk through it together.
What a P&L Statement Actually Is
A profit-and-loss statement — sometimes called an income statement — is a summary of every dollar your restaurant brought in and every dollar it spent over a specific period, usually a week, a month, or a quarter. What's left after the spending is your profit. What's missing is your loss. Simple concept, dense document.
The goal isn't to memorize accounting rules. The goal is to look at a P&L and immediately know where to look when something's off.
The Top Line: Revenue
The P&L starts with total revenue — all the money that came in. In a restaurant, this typically breaks down into:
- Food sales
- Beverage sales (non-alcoholic)
- Alcohol sales (often tracked separately because the margins are different)
- Other income — catering, merchandise, private dining room fees
Pay attention to how revenue is categorized, not just the total. If alcohol sales drop 20% in a month, that's a very different problem than if food sales drop 20%. You can't fix what you can't see.
Cost of Goods Sold (CoGS)
Directly beneath revenue, you'll find Cost of Goods Sold — what it actually cost to produce the food and drinks you sold. This is your ingredient cost, your raw materials.
The number that matters here is your CoGS percentage:
CoGS % = CoGS ÷ Total Revenue × 100
A full-service restaurant typically targets food CoGS around 28–32% and beverage CoGS closer to 18–24% — but benchmarks vary by concept. The point is that this percentage should be consistent. A spike tells you something happened: a vendor raised prices, the kitchen is over-portioning, waste spiked, or someone's stealing.
Gross Profit
Subtract CoGS from revenue and you get gross profit. This is the money available to pay for everything else. It's not profit you keep — not yet — but it's the first checkpoint. A shrinking gross profit means the product is costing more to make relative to what you're charging for it.
Labor Costs
This is usually the biggest line item on the entire statement, and it often surprises beginners. Labor includes:
- Hourly wages (kitchen, floor, bar)
- Manager salaries
- Payroll taxes and benefits
Combined, most restaurants aim to keep total labor between 28–35% of revenue. When labor and CoGS percentages are added together, that's called the Prime Cost — and it's the number experienced operators watch most closely. Prime cost running above 60–65% starts to squeeze out every other expense.
Operating Expenses
Below labor, you'll find a long list of controllable and non-controllable expenses:
- Controllable: marketing, supplies, linen, repairs, utilities (you have some influence here)
- Non-controllable: rent, insurance, permits, loan payments (fixed regardless of how busy you are)
One of the most important skills you'll develop is separating these two categories mentally. On a slow month, controllable costs should flex downward. Non-controllable costs won't move. If rent is 12% of revenue in a great month and 18% in a slow one, the rent didn't change — your sales did.
EBITDA and Net Income
Near the bottom, you'll often see EBITDA (Earnings Before Interest, Taxes, Depreciation, and Amortization). This is a way of measuring operating profitability before financing and accounting decisions cloud the picture. It's useful for comparing one restaurant's performance to another.
The very last line is net income — the actual profit or loss after everything. Restaurant net margins are notoriously thin, often 3–9% at healthy operations. If you see a net margin below 3%, something in the middle of that statement needs attention.
How to Use This When You're Just Starting Out
You don't need to build a P&L to benefit from understanding one. Start by asking to see one — with permission — from a manager or owner you work with. Even a redacted or simplified version teaches you how the categories connect.
Then practice asking one question per section: Is this percentage where it should be? If not, what could cause that? That habit of questioning is exactly what separates a floor employee from someone ready for a management role.
The P&L isn't a test — it's a map. Learn to read it now, before you're the one responsible for the numbers, and you'll walk into that first management conversation with more confidence than most people who've been in the industry for years.
Want to go deeper? In my Food and Beverage Management course, we work through real P&L scenarios line by line — including how to identify problem areas and build an action plan to fix them.

Want to go deeper than a blog post?
Hospitality Operations - Food and Beverage Management
Master every layer of running a profitable restaurant — from kitchen operations and staff leadership to cost control and guest experience. Turn chaos into a smooth, money-making machine.
Start learning — $397 · 30 days access